home |
electronics |
toolbox |
science club |
tuxtalk |
photos |
e-cards |
online-shop

Content:
By Guido Socher
<guido_at_tuxgraphics_org>
|
An ethernet weather station
![[Illustration]](../../common/images2/article07041/eth_weather_st_lcd_title.jpg)
Abstract:
Using an add-on card to the already existing avr ethernet board
we build a weather station. That is: A weather station with a
build-in webserver. The related articles which describe how to
build the AVR web server are here:
- An AVR
microcontroller based Ethernet device
- HTTP/TCP with an
atmega88 microcontroller (AVR web server)
The components for building this weather station
can be ordered from http://shop.tuxgraphics.org
The system is modular. You can either build a pure Ethenet weather station
or an Ethenet weather station with an additional local LCD display.
_________________ _________________ _________________
|
Sensors
My original plan was to have sensors for temperature, air
pressure and wind. I started a prototype and it worked very well
except for the wind measurement part.
I have written a separate article about it:
wind-vane-ver01.shtml. I plan to improve the wind
measurement hardware and add it at a later point in time.
For now the weather station has 2 temperature sensors and an
air pressure sensor. It works reliable and precise even after
several month of testing.
For the sensors we will use:
- For temperature measurements: LM335. This sensor is cheap
and has a linear curve over a wide temperature range.
This will give us very accurate temperature
readings over a wide range. The accuracy will be almost constant over
the whole range.
- A Motorola/Freescale MPX4115A absolute air pressure
sensor. This sensor is already calibrated at production time.
The MPX4115A is not made for
out-door use but that is not a problem. The circuit can be in
a save and dry location inside the house as the air pressure
is exactly the same inside and outside the house.
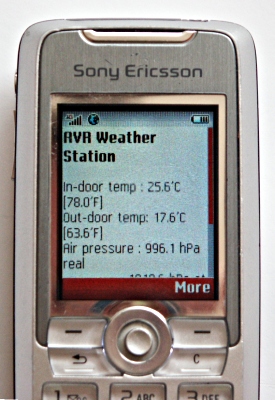
The Ethenet Weather Station as seen from a Mobile Phone
|
What's the weather at home?
You can connect it straight to the Internet by enabling port forwarding
in your DSL router. There is however a security issue with such a
straight forward solution. How to manage security and make it really secure
is described in the Using
the AVR microcontroller based web server article (available via the
tuxgraphics electronics section http://tuxgraphics.org/electronics/).
The analog to digital converter (ADC) of the AVR
The atmega88/168 has one build in ADC and a multiplexer which
allows us to select the pin on the chip where the voltage should be
measured. In other words even though there is just one ADC it
appears as if it had several ADCs. The one ADC can measure
the voltage on several pins quickly after each other. It has
also an internal reference of 1.1V. The 1.1V correspond to an ADC
reading of 1023 and 0V to an ADC reading of 0. The measured
voltage is therefore:
   ADCreading
U= ---------- * 1.1V
      1024
If we now look at the specification of our sensors we will see
that the range we want to measure does not correspond to
0-1.1V. We could just add a voltage divider (two resistors) to
reduce the max. voltage to 1.1V but then we will loose accuracy
as this will map the interesting range to just a few ADC
values and we will never use the full range from 0-1023.
The solution is a differential amplifier. With such an
amplifier we can map e.g a range from 3.6V to 4.15V into
0-1.1V:
Mapping of a voltage range into the ADC input range from
0-1.1V
Differential amplifiers
An easy way to build such a differential amplifier is to use
two transistors.
The problem is that this circuit has a temperature dependent
amplification factor. This is even the case if we use
additional resistors for degenerative feedback because the
amplification factor of this circuit is too low. We would need
to add more transistors.
The most common solution to the problem is an operational
amplifier. Here the amplification factor can be made dependent only
on external resistors and therefore temperature
independent.
A differential amplifier with adjustable gain based on an
operational amplifier.
Most operational amplifiers need +12 and -12 supply voltage and
that is not really usable here. We would like to have a single
exact +5V power source as the air pressure sensor needs exactly
5V. Fortunately there are some special operational amplifiers
which can work from a single power supply and still work with
voltages as low as 5V. The TLC272 is such an amplifier and that
is what we will use here.
The weather station circuit diagram (add-on board)
The circuit diagram below shows the circuit diagram of just the
add-on sensor board. It connects via CONN2 to a any tuxgraphics avr ethernet board.
Click on the picture to get a high resolution PDF
drawing.
The TLC272 is a dual op-amp. For 3 sensors we need therefore two
TLC272 and we could actually connect 4 sensors. CONN3 is
therefore available for you to put any other additional sensor.
You can e.g connect a Honeywell HIH-4000 humidity sensor. This humidity
sensor can however also be connected directly via a voltage divider
to the adc. It's just an idea. At the moment the humidity sensor is
not part of this software/solution.
If you don't want to use the extra connector then insert a wire
bridge instead of R14 and R19. All other resistors around that operational
amplifier can then be left open.
R27 is dependent on the altitude where you are. For 0-400m above
sea level you should use 5.6K and for 400-1000m 18K above 1000m
you should remove R27 and much higher you will have to change
R24. This because the air pressure is very dependent on the
altitude.
The circuit has an on-board voltage regulator because it is
important to have a clean and very stable supply voltage to get
exact sensor readings. The 4 analog output lines (CONN2)
connect then to the ADC channels ADC0-ADC3 on the avr webserver
board.
If you use the same power source for this add-on sensor board
and the avr webserver then you should make sure you connect GND
only once to avoid ground loops (CONN2 has also a GND pin).
Ground loops cause the circuit to be sensitive to magnetic
fields (transformers). If you use e.g a 7.5V power supply then
you connect the +7.5V to both the avr webserver board and the
add-on sensor board but you connect the GND of the power supply
only to the avr webserver board and the add-on sensor board
gets it's GND connection via the GND pin on connector CONN2.
Power supply requirements
Ethernet works reliably over 100m long cables. It needs therefore
a bit of power. The main power consumer is the ethernet chip.
The rest of the circuit needs so much less that it
can be totally neglected in any power consumption calculations.
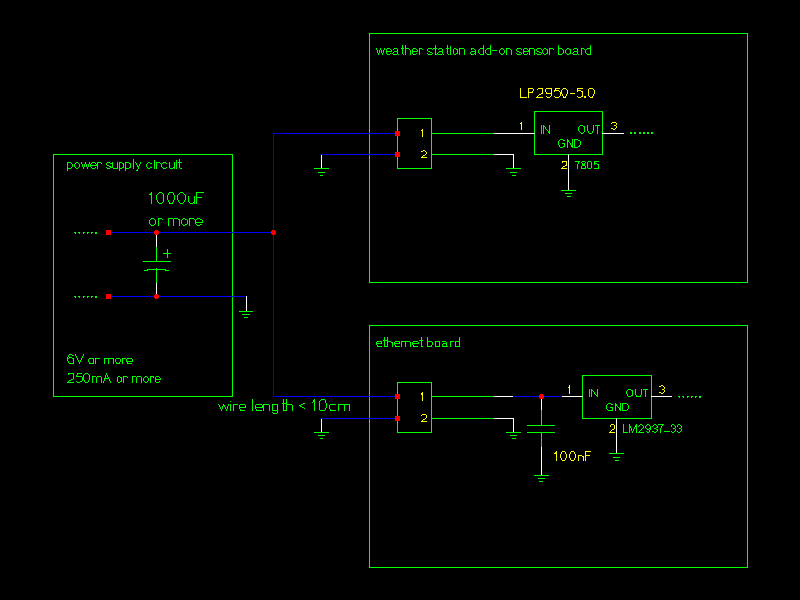
Click on the picture to get a high resolution PDF
drawing.
The ethernet chip needs in average 150-180mA at
3.3V. This is however an average. At the moment of packet processing
it needs twice as much for a few milliseconds. It is therefore important
that the power supply circuit contains a large capacitor which can
buffer that peek. The tuxgraphics ethernet board has already a number
of capacitors on board to make the peek more round but it still needs
a good external power source.
If you use a ready made switched power supply (as I did) then it is often unknown how
big the internal capacitors are. It is however very easy to test if the
capacitors are big enough:
Click several times the reload button in the web browser
and observe the temperature
readings. If the temperature values are changing all the time
then the power breaks down so much that the sensor board is influenced
by that. Just add a 1000uF capacitor in this case. Note that the pressure
sensor may fluctuate behind the decimal point. That is normal.
The main power design guidelines are therefore:
- Use a big capacitor (1000uF or more) in power circuit
- Avoid ground loops.
- Keep the wires short.
Converting voltages into "weather" readings
The temperature and air pressure readings arrive now on the avr
webserver as ADC reading. Numbers between 0 and 1023. The main
task of the software is now to convert this back into Celsius,
Fahrenheit or hPa and display it on a web page.
The LM335 temperature sensor produces 10mV/K (mV/K=
Milli_Volt/Kelvin). This is however only valid if the measurements
are taken with very high impedance. The impedance of our
differential amplifiers is 91K + 68K = 159K. The datasheet of
the LM335 does unfortunately not explain what will happen but
the voltage drop at a load of 159K should be very low given
that the impedance of the LM335 must be much less than 4.7K
(the pull-up to 5V). The amplification factor of the amplifier
is 91K/68K=1.338. The ADC produces a reading of 1024/1100 per
mV. In other words we get 12 ADC-steps per Kelvin:
10mV/K * 91K/68K * 1024/1100mv = 12.4 ADCsteps/K
The whole conversion can be fine tuned in the file config.h
(see source code download at the end of this article) and the
parameters KELVINPERADC0 and KELVINPERADC1 correspond to this
ADCsteps/K times 10. If neither the resistors nor the LM335 had
any tolerances then both KELVINPERADC0 and KELVINPERADC1 should
have 124. The file config.h contains in the temperature section
also the parameters OFFSET1 and OFFSET0. This is an offset to
0'C. The offset may change if the supply voltage is not exactly 5V (
the reference for the differential amp. changes then).
If you don't have a very accurate reference to calibrate the
temperature readings then I suggest to not change too much in
config.h It will be almost correct. What you can do is this:
Take some tape and stick both LM335 together. Wait 10min for
them to have exactly the same temperature then check what the
readings are. Now change KELVINPERADC2 and KELVINPERADC1 such
that the two temperature readings are the same for both sensors
and meet in the middle (increase the one which is too low and
the lower the one which is too high).
The air pressure sensors is just slightly more complicated.
First of all you should know that the air pressure changes
maybe by 1-5 hPa over the day. A weather dependent high
pressure zone might have 1030 hPa and a low pressure zone 1010
hPa. The air pressure is however much more dependent on the
hight above sea level. If you change your altitude by just 100m
then the pressure will change by 12 hPa. It is therefore
a convention that all weather stations report a pressure reading
normalized to sea level. The pressure offset to sea level is:
Poffset=1013hPa * (1-(1- 0.0065 * h/288)^5.255)

h=height above sea level.

The formula can be derived from the Barometric formula.
See http://en.wikipedia.org/wiki/Atmospheric_pressure
and http://en.wikipedia.org/wiki/Barometric_formula
The file config.h contain the parameter SEALEVELOFFSET which is
exactly this Poffset times 10 rounded to the next integer
value. Here is a javascript calculator to calculate the
SEALEVELOFFSET parameter for you:
Some encyclopedias and local maps will usually show at what hight above
sea level your town is. If you live in a high building then you need
to take this also into consideration.
The reference voltage for the differential amplifier depends on
R27 which is to be selected dependent on your altitude. Since
most people on earth live near sea level you will either use
5.6K (0-400m) or 18K (400-1000m) for R27.
The reference voltage (the voltage over R23) is calculated as
follows:
Refvoltage=5V * 5.6K/( 5.6K + 1/(1/R27 + 1/2.7K))
The differential amplifier amplifies the difference between
this reference voltage and the voltage from the air pressure
sensor. Now we just need a formula that gives us the air
pressure for a given output voltage of the air pressure sensor
and we are almost done with the calculations:
Vout=5V* ((0.0009*P/hPa)-0.095)+Error

Vout= output voltage in V at the MPX4115A pressure sensor
P=air pressure in hPa
Error=an error term caused by tolerances during the manufacturing
      of the MPX4115A.

Therefore P is:
P=((Vout+Error)/5V+0.095)1111.11 hPa

P=(Vout+Error)*1/V*222.222 hPa +105.555 hPa

If we convert Vout into ADC steps  and included also
the error term there then we get:
P=(adc/1024*1.1/Gain +Refvoltage/V)*222.222 hPa +105.555 hPa

The gain of the differential amplifier is 100/47=2.1
We insert this into the equation:

     adc *1.1 * 222.222 hPa
P = ------------------------ + (222.222 *Refvoltage)hPa/V + 105.555hPa
       1024 * 2.1


     adc *10
P = --------- hPa + (222.222 *Refvoltage)hPa/V + 105.555hPa
     87.8

In the config.h file I have included a REFTERM_A parameter which is
this term to the right of the above equation:

     adc *10
P = --------- hPa + (REFTERM_A/10) hPa
     87.8
Now that is a lot of math but don't worry the software is
already written. If you just want to use it then measure the
voltage above R23 or use the above javascript calculator and
then calculate REFTERM_A with the following calculator. Insert
REFTERM_A in the config.h file and you are done.
Something we have now discarded a bit is the Error term in the
formula for the MPX4115A pressure sensor. It is part of the adc
variable in the above formulas. In the config.h file I have
included a parameter called ERROR_A. If you have no reference
available then just set it to zero. If you have some weather
station readings from a station near by then you use that to
tune the Error term. Here are e.g some weather forecasts
including readings from the current day:
The software
Just download the eth_rem_dev_weatherstatio-x.y.tar.gz file
at the end of this article. Unpack it (tar zxvf
eth_rem_dev_weatherstatio-*). Most of the above formulas are
implemented in the file analog.c but the configuration is done
via the header file config.h. Edit also the main.c file and
insert the IP address you would like to use. Compile the software
with the command "make". After that just download the
eth_rem_dev_weather.hex into the microcontroller:
avrdude -p m88 -c stk500v2 -e -B 2 -U flash:w:eth_rem_dev_weather.hex
That's all!
Point your web browser to the selected IP address
(e.g htpp://10.0.0.25 ) and see what the weather will be like.
Mounting the out door sensor
It is probably possible to seal the LM335 out-door sensor in
resin or glue to make it water proof. I personally don't
believe in such methods because one day some water will get in,
stay there and corrode the wire. It is better to just
shield it against heavy rain and otherwise make sure that it
can always dry again. A half open tube is very good for that. I
use a felt-tip cap:
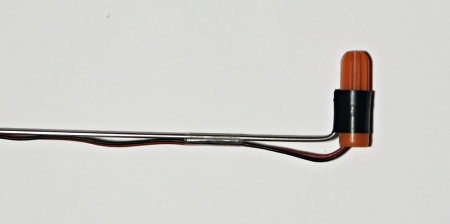
The out-door sensor. Protected by a felt-tip cap.
The weather station as seen from firefox
A screen shot of mozilla firefox
High air pressure (above 1020hPa) is generally an indication for coming good
weather. Low pressure may bring rain.
If you see the air pressure increasing in the evening then it is a good
indication that there will be no more rain the next day.
The final circuit without LCD
The whole weather station circuit is very modular. You can use it with and without air
pressure sensor and the LCD display is also optional. Below is
a photo of the weather station without LCD display.
![[weather station circuit without LCD]](../../common/images2/article07041/weatherstation_no_lcd.jpg)
The bare Ethernet weather station circuit without LCD
The software made for the weather station with LCD
(eth_rem_dev_weatherstation-3.X) will also run
on the one without but I recommend to use eth_rem_dev_weatherstation-2.X
which does not use the digital IO port of the ethernet card and
is made for the weather station without LCD.
Adding a LCD display
Just connect the LCD display on the exact same pins as in the previous
article "A LCD display with ethernet interface":
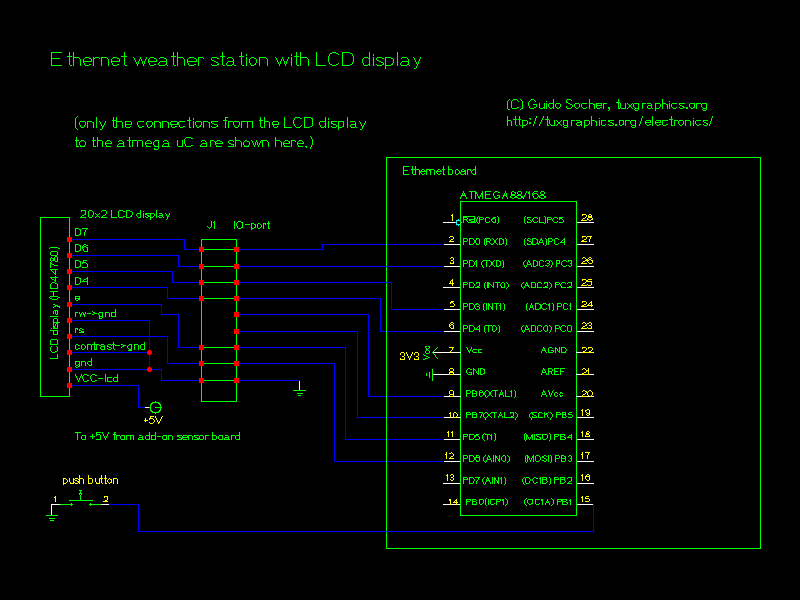
Click on the picture to get a high resolution PDF
drawing.
I have decided to connect the button to change the display
on PB1 because we don't need the LED which is normally connected
there. The button toggles the display units from 'C to 'F.
Here some photos of the Ethernet weather station which I build. It is
very small. On the back you just connect power, ethernet and the out-door
sensor.
![[weather station circuit with LCD]](../../common/images2/article07041/eth_weather_st_lcd_txt.jpg)
Ethernet weather station circuit without LCD
![[weather station circuit with LCD, top view]](../../common/images2/article07041/eth_weather_st_lcd_topview.jpg)
Ethernet weather station circuit with LCD, top view
On the software side there really nothing new here. We just
display the temperature and air pressure readings locally on the lcd
display. A small "+" sign in the lower right corner of the display comes
and goes to let any human person know that everything is still working and
the display is not frozen (temperature and air pressure change very slowly
during the day). The lcd driver code
is in the files lcd.c, lcd.h and lcd_hw.h.
Feed a database
The web server displays a web page. That page can not only be
evaluated by humans but also by scripts. You might e.g collect
the readings every few hours and save it in a file or database.
The the command line web browser w3m
(http://sourceforge.net/projects/w3m/) can be used for that.
w3m -dump "http://10.0.0.25/"
That's all you need to get machine readable readings. You can
re-direct the output to a file and then process that file. Very
easy.
Download and links
© Guido Socher, tuxgraphics.org
2007-05-17, generated by tuxgrparser version 2.55